

A leading fast-moving consumer goods (FMCG) company partnered with SYMAR to answer a practical question: where can synthetic respondents augment established consumer research without lowering the standard of evidence?
Across four product lines and 4,300 synthetic study records, the program found a clear distinction. Packaging studies produced useful benchmarked evidence. A shelf test exposed execution questions worth investigating. A flavor-prioritization study did not reproduce the human ranking and should not guide launch decisions on its own.
The outcome was a practical use map, not a claim that synthetic research can replace people across every research task.
The client, products, variants, and flavors are anonymized. Product A through Product D refer to separate product lines. Figures and results are drawn from the client case-study document; selected details are omitted to protect confidentiality.
The Program at a Glance
| Study | Design | What the evidence supports |
|---|---|---|
| Product A: packaging redesign | Six designs across four European markets; 24 cells and 2,400 synthetic records | Eight of nine rating measures within 0.12-0.28 scale points of human means; useful score calibration, not standalone winner selection |
| Product B: travel packaging | Four packs across seven nationalities; 300 recurring personas and 1,200 route evaluations | All 12 core appeal, purchase-intent, and brand-fit gaps within nine percentage points; a shared development direction |
| Product C: shelf and range | Two independent monadic cells of 150 synthetic respondents; 36 matched measures | Diagnostic questions about quantity, value, sharing, and shelf execution; not a replicated purchase decision |
| Product D: flavor prioritization | 400 synthetic respondents, 25 flavors, and 16 repeated MaxDiff tasks | Negative alignment with the human ranking; stronger sensory grounding and human validation required |
The 4,300 total combines study records and route evaluations. It is not a count of unique respondents: Product B’s 300 personas each assessed all four routes.
The Challenge: Test Real Research, Not a Generic AI Demonstration
The client’s insights team wanted to work with real questionnaires, visual stimuli, detailed target definitions, and multinational study designs. Human comparison was built into the program wherever benchmark evidence was available.
Success meant understanding both where synthetic evidence held up and where it did not. A close average score would not, on its own, establish that a method could identify the winning design. A completed questionnaire would not establish that its answers predicted human preference.
What gave us confidence was not that every synthetic study matched. It was that the packaging studies produced useful benchmarked evidence, the shelf test opened up practical execution questions, and the flavor test clearly showed where human validation still matters. That gave us a practical basis for deciding when to use synthetic research and when to calibrate further.
G.C., AI Transformation Manager, Customer Insights.
The Approach: Preserve the Research Structure, Compare Against People
SYMAR created a dedicated research environment for the client. Target criteria and human respondent profiles informed structured, market-specific synthetic respondent pools. Existing questionnaires were rebuilt in the platform, with visual material presented at the appropriate point in the study logic.
The workflow supported localized respondent definitions, translated questionnaires, monadic cells, packaging concepts, shelf scenes, and both quantitative and qualitative outputs. No grounding data were used for these tests. Human results served as comparison evidence, not proof that every synthetic measure was calibrated.
The four studies deliberately spanned different research demands: evaluating visible packaging, interpreting shelf execution, and imagining sensory preferences.
1. Product A: Close Packaging Rating Levels, Not a Design-Winner Model
The back-of-pack evaluation applied one research structure across four European markets while preserving local language, demographic, household, shopping, and category context. Six designs in each market produced 24 concept-market cells, with 100 synthetic respondents per cell.
Across eight of nine rating measures, mean absolute error (MAE) against human results ranged from 0.12 to 0.28 scale points. Those measures covered overall liking, needs fit, purchase intent, rear/front pack fit, affordability, pack image, sticker liking, and sticker/rear fit.
The exception was Unique & Different, with an MAE of 2.18 scale points. Uniqueness required separate calibration rather than being treated as another well-matched score.
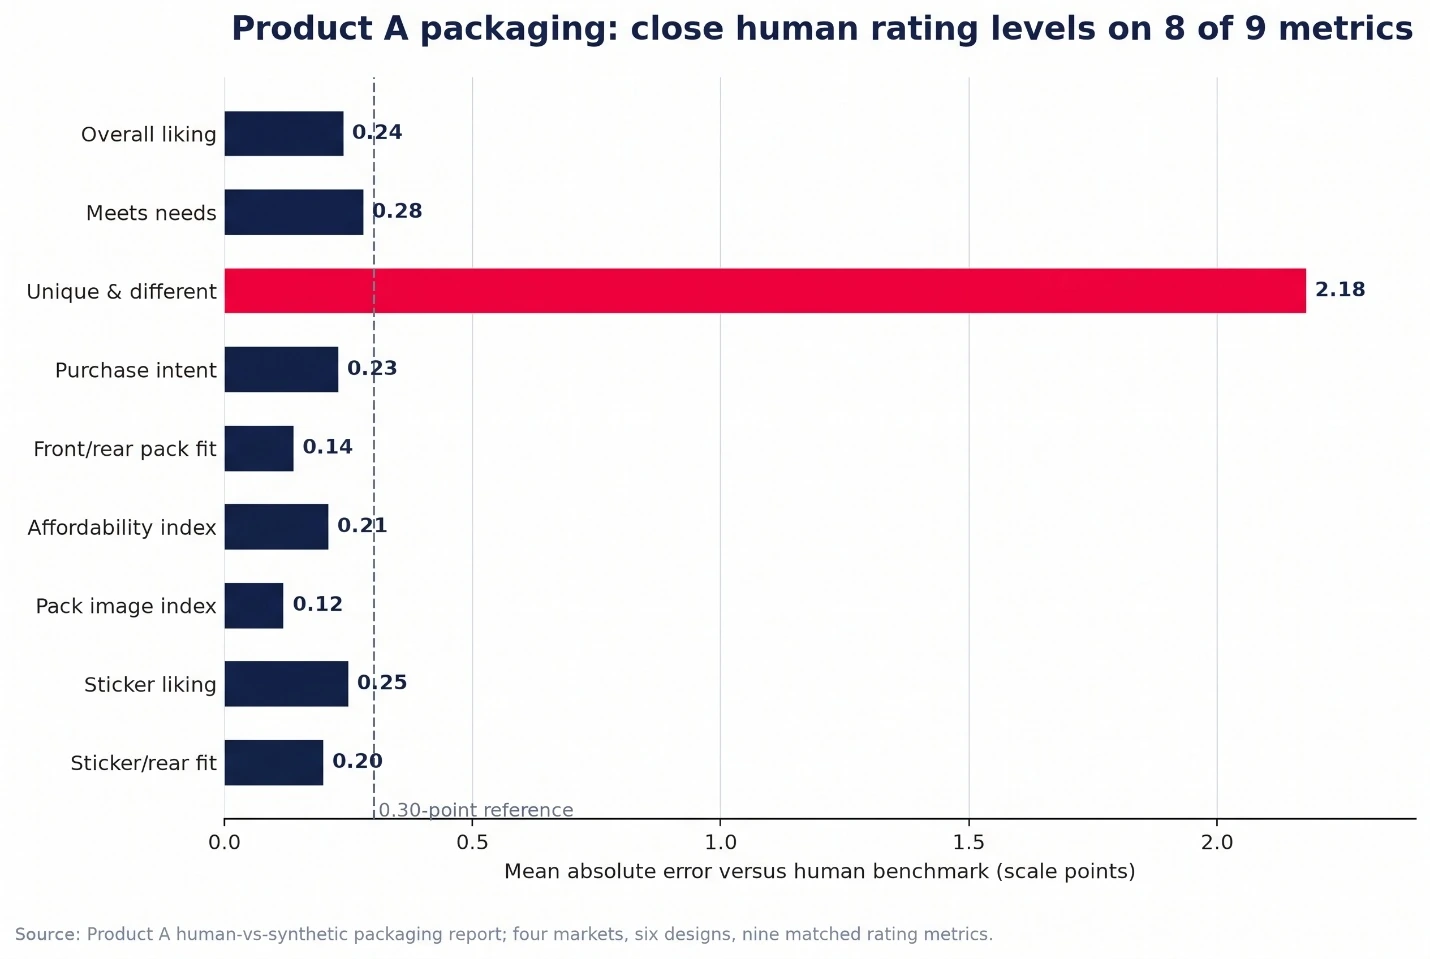
Figure 1. Product A rating calibration across four markets and six designs. Bars show mean absolute error against human benchmarks, not the underlying mean ratings. The 0.30-point line is a reference, not a significance threshold.
The practical value extended beyond numeric ratings. Synthetic open-ended responses surfaced recurring questions about:
- Rear-copy clutter and legibility.
- Portion size and value communication.
- Recipe and QR-code usefulness.
- Sustainability and recognizable product cues.
What this supports: approximate rating levels and scalable packaging diagnosis across markets.
What it does not support: autonomous selection of a winning design. Design-level correlations were near zero for most measures, despite close overall rating levels. Human means came from the client’s presentation; respondent-level human data were not available for re-testing.
2. Product B: Core Packaging Signals and a Shared Development Direction
The travel-pack study provided a second packaging comparison. The human study included 630 travelers in a monadic design. The synthetic study used 300 recurring personas across the same seven nationalities, with each persona assessing all four routes: 1,200 evaluations and 60 aligned pack-by-metric comparisons.
Appeal, purchase intent, and brand fit calibrated consistently across the four packs. All 12 core-KPI gaps were within nine percentage points. For New Route 2:
| Core measure | Human | Synthetic |
|---|---|---|
| Appeal | 92.0% | 91.3% |
| Purchase intent | 96.0% | 87.3% |
| Brand fit | 97.0% | 97.7% |
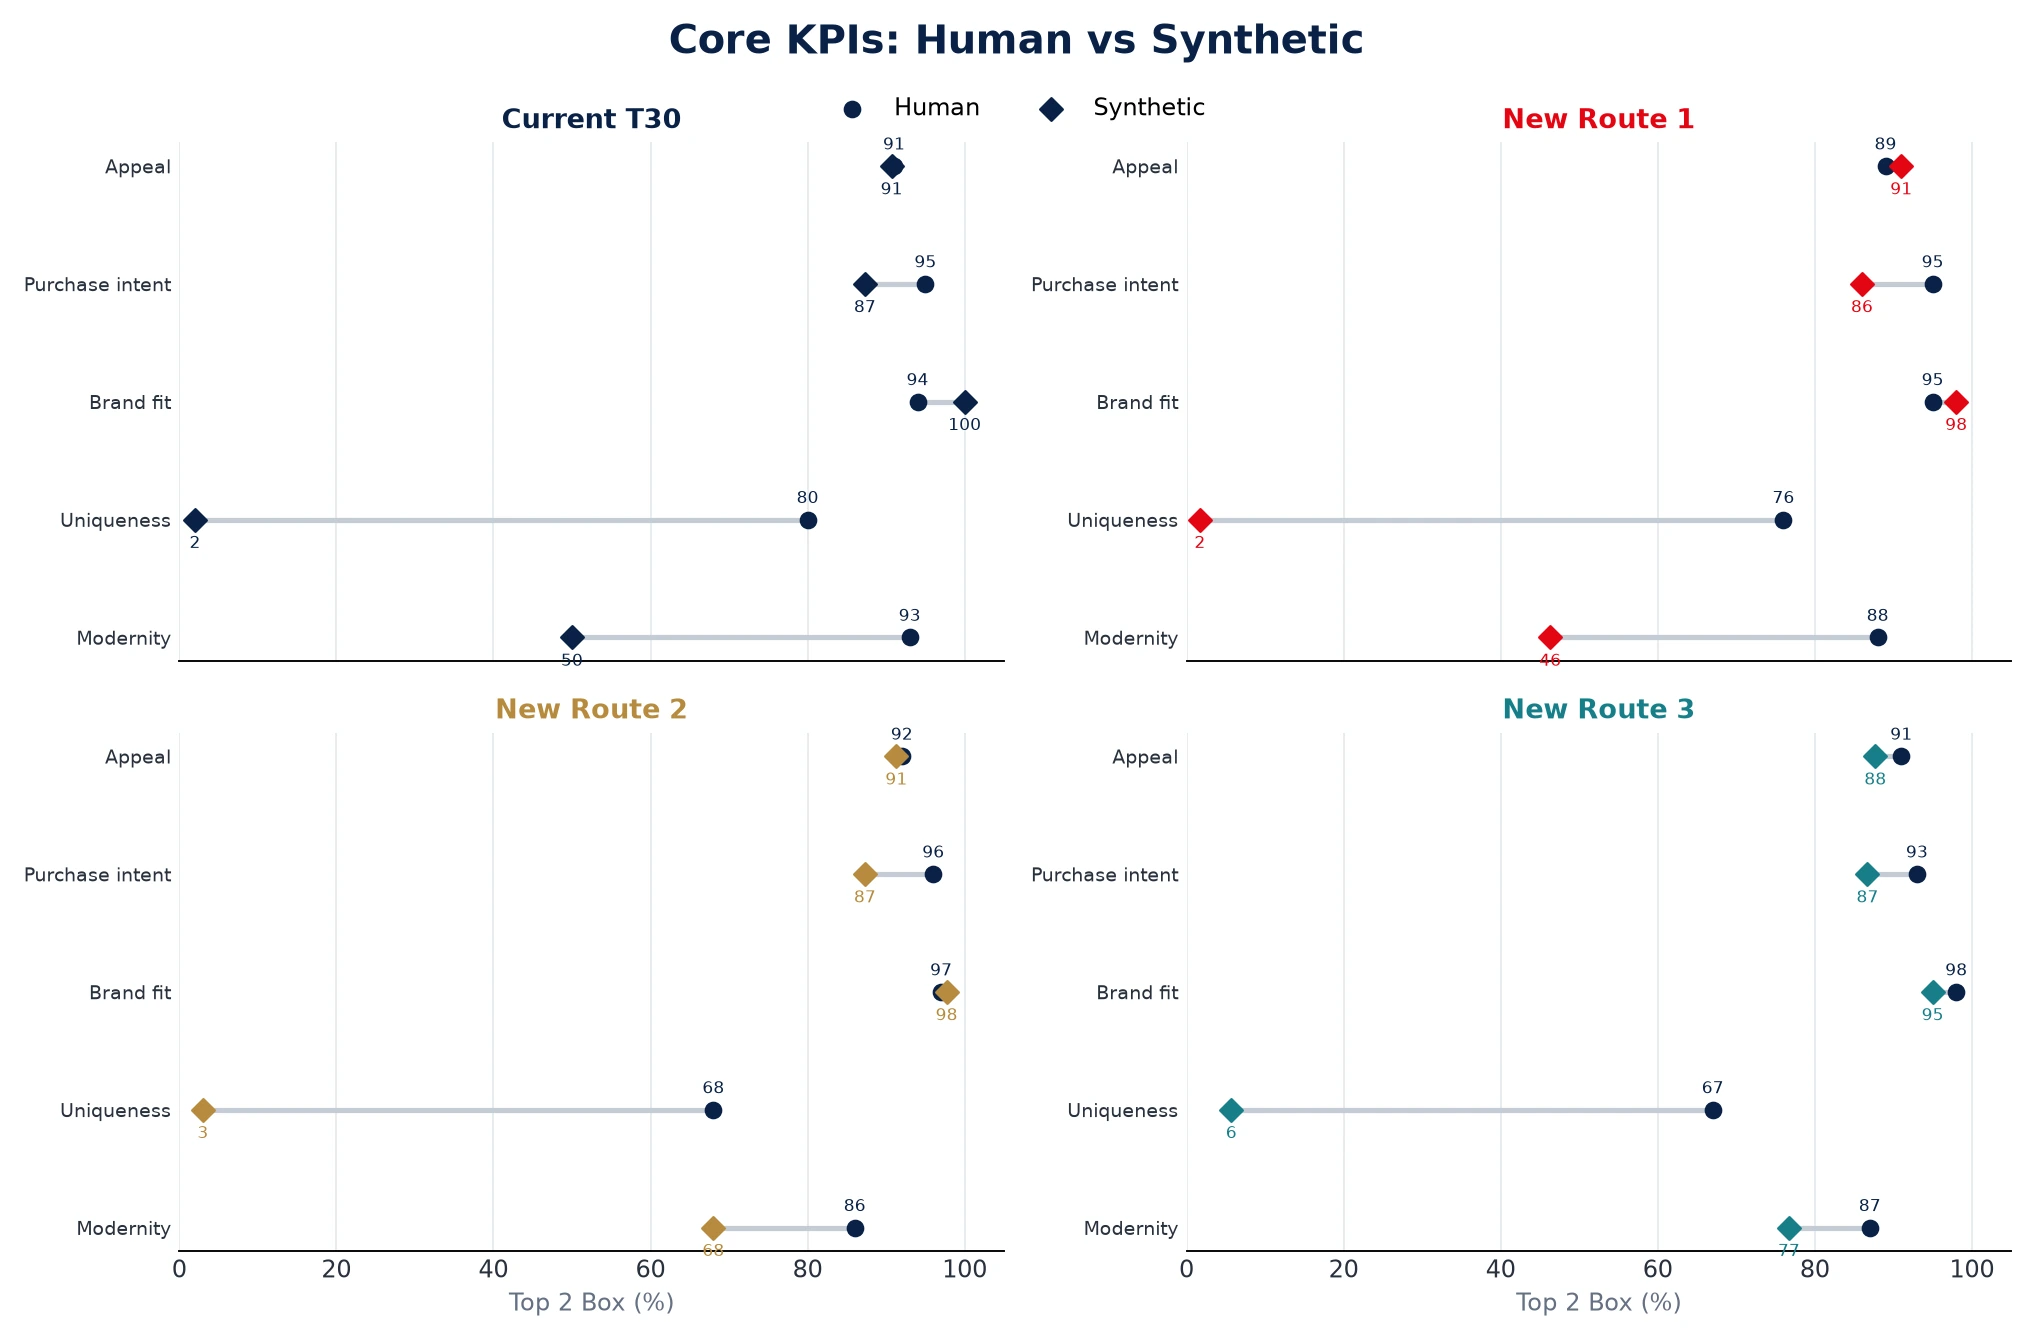
Figure 2. Human and synthetic Top-2-Box scores for Current and three new routes. Labels are rounded; the table above preserves the reported Route 2 decimals. Short connectors on core measures contrast with much larger uniqueness gaps. These are descriptive comparisons, not evidence that every measure is calibrated.
Both studies put Route 2 first numerically on appeal. Its celebration association also increased versus Current in both evidence streams: +8.0 percentage points in human results and +6.4 in synthetic results.
That agreement supported progressing Route 2 for development, not declaring it an independently validated winner. Human direct preference placed Route 2 at 31%, but it was statistically tied with Current at 27% and Route 3 at 26%.
Qualitative coding helped turn the result into an optimization brief. Route 2 retained premium and gifting cues, while 88.7% of its coded dislikes mentioned clutter or legibility. This percentage describes coded dislikes, not all respondents. It aligned with human concerns about decorative density and plastic.
The development brief was concrete: retain the gift-wrap idea, simplify small decorative details, and restore a stronger travel cue.
The Calibration Boundary
Across all 60 comparisons, the median absolute Top-3-Box gap was 7.0 percentage points, and 66.7% were within 10 points. Performance was uneven: synthetic responses materially understated uniqueness, exclusivity, standout, and strict Top-Box intensity, with modernity also less well aligned than the core measures.
The human monadic design and repeated synthetic-persona design were not identical. Fixed image order also confounded synthetic direct preference. Human preference therefore remains authoritative, and weakly calibrated absolute scores should not be used as human-market forecasts.
3. Product C: Better Questions About Shelf Execution
The shelf experiment compared current and proposed duty-free shelves through two independent synthetic samples of 150. The proposal introduced an additional product and variant, reduced duplicate facings of established variants, and changed the visible multipack quantity while holding price constant.
The synthetic read identified opportunities. Purchase openness for Variant A remained at 94.7%; Variant B increased from 48.0% to 55.3%; and Variant C reached 42.0% at a suitable price.
At the same time, strongest offer liking fell 12 percentage points and perceived expense rose 12 points for both established variants. Respondents repeatedly asked for clearer quantity, saving, and duty-free-value cues.
The human-versus-synthetic comparison for the proposed pack showed reasonably close readings on ease of understanding and familiarity. Synthetic respondents were more critical of duty-free fit, quality, travel gifting, and sharing. Very high synthetic total-like scores coexisted with much lower strict “like very much” scores than in the human results, indicating a response-intensity difference.
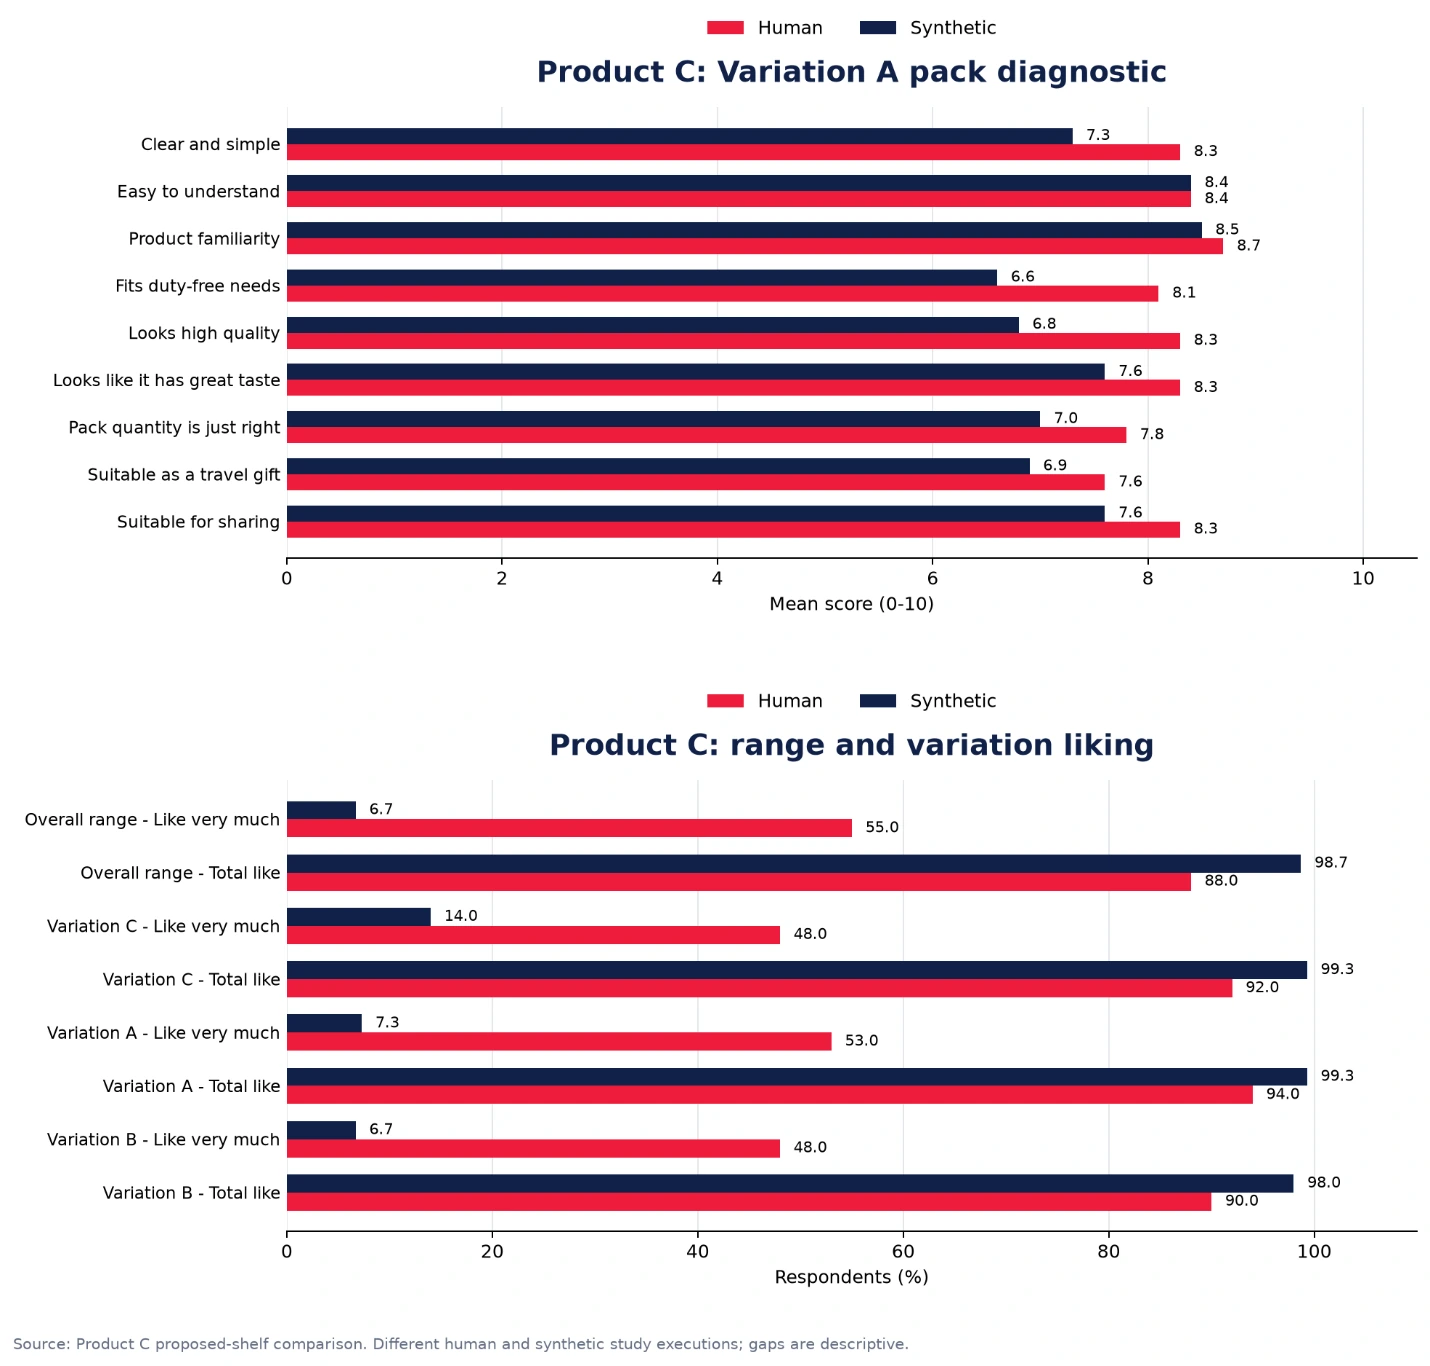
Figure 3. Proposed-shelf pack attributes and range liking. The upper panel uses mean scores from 0 to 10; the lower panel uses respondent percentages. Different study executions and response intensity make these diagnostic, descriptive gaps rather than replicated purchase outcomes.
Directional Agreement Was Not Universal
Both evidence streams raised quantity and sharing concerns, but at different levels:
- Human “absolutely sufficient” quantity fell from 55% to 49%; synthetic sufficiency fell more sharply for the two established variants.
- Human sharing Top-2 fell from 82% to 72%; synthetic sharing fell from 48.7% to 41.3%.
- Human total-expensive perception fell from 74% to 69%, while synthetic expensive perception rose by 12 percentage points.
Purchase questions were not directly comparable. The study therefore does not show that synthetic respondents replicated the human shelf decision.
Its value was diagnostic: does the revised quantity still feel right for sharing, does the price communicate sufficient value, and does the pack look premium and travel-relevant? Those questions translate into changes to pack copy, quantity cues, price signage, variant distinction, and facings before rollout.
4. Product D: Flavor Ranking Did Not Validate
The flavor retest asked 400 synthetic respondents to evaluate 25 flavors through 16 repeated MaxDiff choice tasks. In each task, respondents selected the most and least preferred options.
Execution completeness was high: 6,302 of 6,400 task screens contained complete best/worst pairs. The validation result was not decision-ready. Against a 400-person human benchmark:
| Validation measure | Raw synthetic retest |
|---|---|
| Pearson correlation | -0.14 |
| Spearman rank correlation | -0.15 |
| Mean absolute error | 36.6 points on a normalized 0-100 scale |
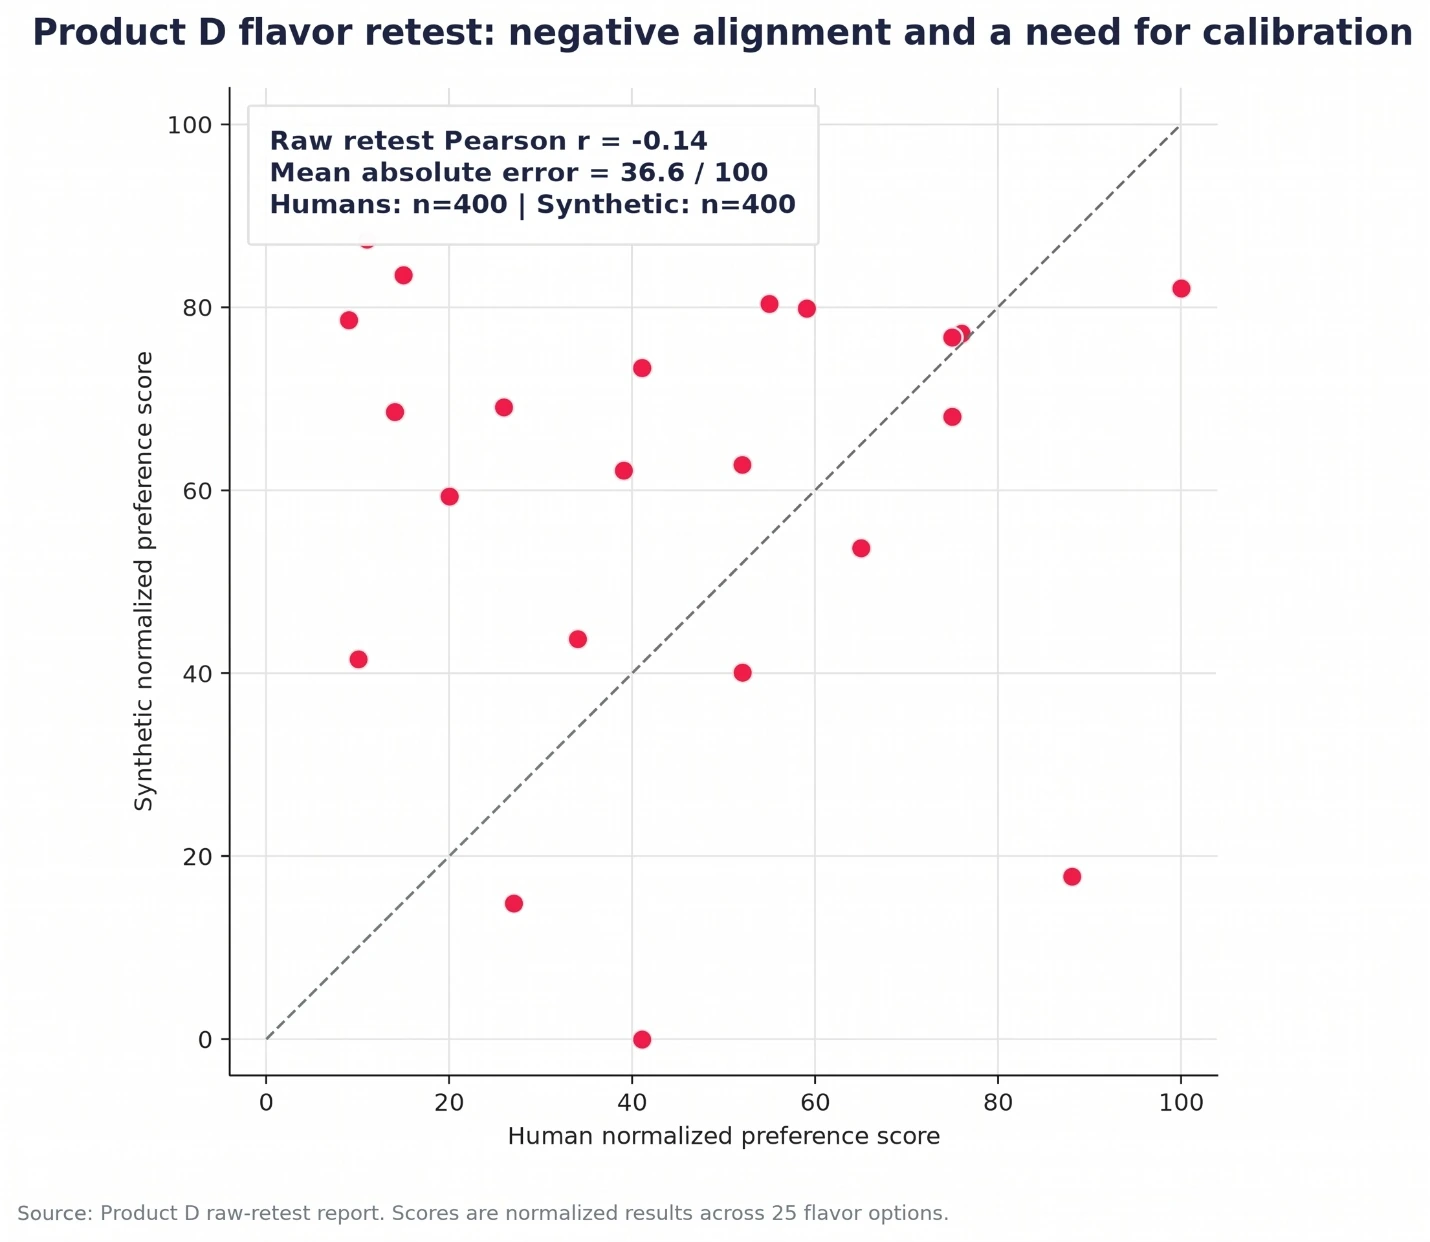
Figure 4. Each point represents a flavor; the dashed diagonal marks equal human and synthetic scores. The raw retest did not reproduce the human flavor ranking and should not be used alone to select launch flavors.
The misses were commercially meaningful. One anonymized flavor moved from human rank 25 to synthetic rank 3, with a +98.5-point gap. Another moved from human rank 2 to synthetic rank 23, with a -70.2-point gap. The synthetic sample also over-indexed a third flavor, despite 87% reporting purchase of the product in the previous three months.
These results point to both a persona-pool calibration issue and a harder methodological limit: imagined flavor preference lacks the lived sensory cues available to human respondents. Questionnaire completion and stated category familiarity did not establish predictive validity.
What Must Change Before Using This Method for Flavor Selection
- Rebalance the persona pool against the human benchmark on purchase recency, category behavior, and flavor repertoire.
- Add sensory calibration through grounding data rather than asking models to infer taste from demographics and stated habits.
- Predefine validation gates for Pearson and Spearman correlation, MAE, and top-flavor overlap.
- Retain a human holdout and do not use the method as a standalone flavor-selection tool until it clears those gates.
The Impact
The engagement established a repeatable way to decide when synthetic respondents can support learning, when they should be paired with human research, and when a question still belongs primarily with people.
Packaging diagnostics were the strongest current fit. Product A closely reproduced most approximate rating levels. Product B reproduced core appeal, purchase-intent, and brand-fit signals and contributed to a credible development brief.
Calibration was measure-specific. Strong results on one measure did not make uniqueness, response intensity, or winner selection forecast-ready.
Shelf research sharpened the next discussion. Product C exposed questions about quantity, sharing, price communication, and shelf architecture, even where human and synthetic price readings diverged.
Sensory preference remained human-first. Product D’s negative rank alignment made the limit explicit: stronger grounding and human validation were necessary before using synthetic outputs for flavor selection.
The conclusion is not a binary choice between human and synthetic research. Start with real research questions, preserve the methods that make evidence useful, compare against people, scale what holds up, and investigate what does not.
For this FMCG leader, SYMAR’s role was to support packaging diagnostics and reveal execution questions while retaining human evidence for sensory experience, preference, and high-stakes winner selection.
Explore This Approach
Explore synthetic surveys, build research personas, or talk to the SYMAR team about a benchmark-led research program.